The TechnoSales course has 20 assignments divided into six sessions.
Session 1: Introduction to Excel
Students are introduced to Microsoft Excel and spreadsheet terminology. To learn about the program, students play "You Found my X-Cell". This game has students identify cell references, navigate in a worksheet, enter data, fill cells with color, format the appearance of text, change the alignment, apply borderlines, and select multiple cells. It is a fun way to learn essential spreadsheet skills.
Session 2: What Desserts Do Students Prefer?
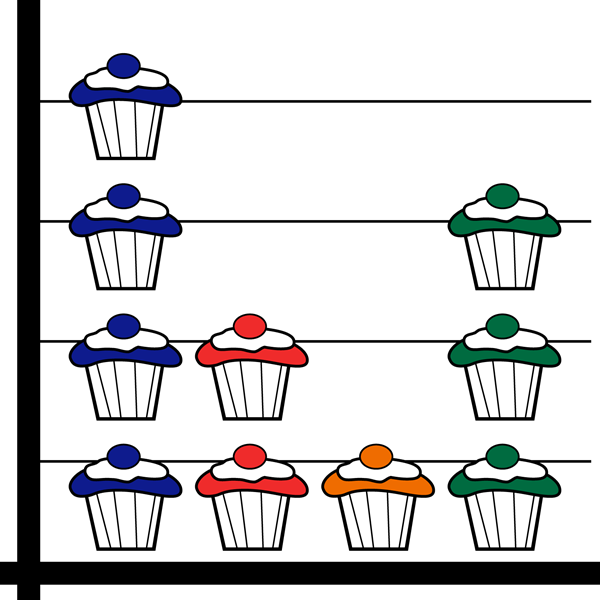
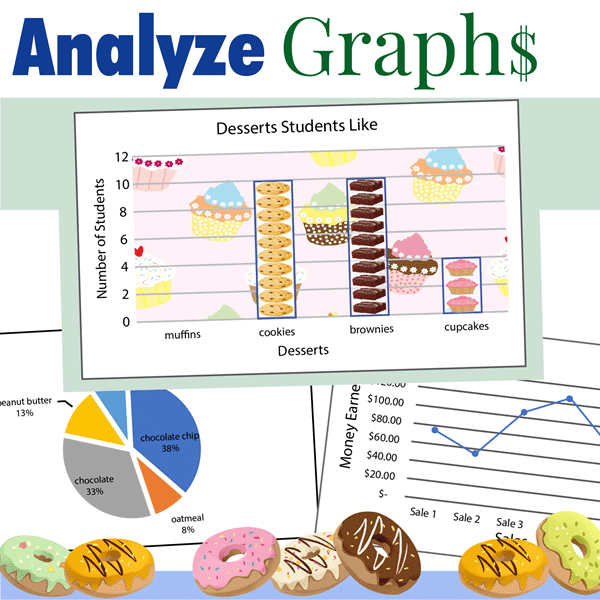
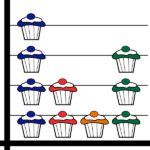
Students learn how to use Microsoft Excel to make decisions about their upcoming bake sale. To make this fundraiser a success it is essential that the dessert sold is a popular item. To answer the question "What desserts do students prefer?" students conduct a survey. The results are organized into a worksheet and then placed into a column graph. The data is then analyzed to determine the dessert item that students prefer. Will it be cupcakes, muffins, or cookies?
Session 3: Are There Differences Between Desserts Boys and Girls Prefer?
Students continue to analyze the results of the Dessert Preference Survey. To answer the question, "Are there differences between desserts girls and boys prefer?" a double column graph is used to compare the types of desserts both like to eat. This graph will help students to select a bake sale item that everyone will enjoy. By studying the graph, they will be able to make a decision that will ensure success.
Session 4: What Dessert Flavors Do Students Like?
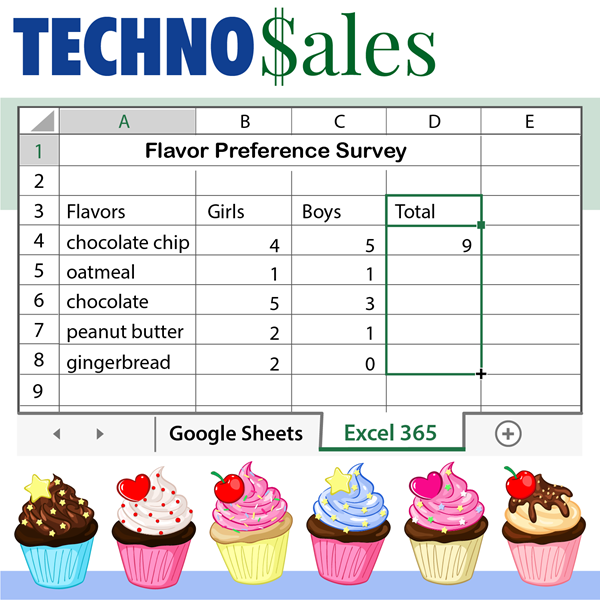
Students must decide the flavors of dessert to have at the bake sale. This information is important because there need to be plenty of items that people like. To answer the question, "What Flavor of Dessert do Students Like?" they conduct another survey. The results are organized into a worksheet and then placed into a pie graph. The data is then analyzed to determine the flavor students should sell. Will it be chocolate, vanilla, or strawberry?
Session 5: How Many Dessert Items Do You Need?
Students calculate the number of desserts required for the sale. This information is important because there must be enough items to sell to raise a certain amount of money. To answer the question, "How many Dessert Items do you Need?" past sales are studied. The sales information is organized into a worksheet and placed into a line graph. The data is then analyzed to estimate the average money earned in previous sales. This information is used to set a financial goal. Afterwards, formulas are created to calculate a fair price, amount of baked goods needed, and the number of items each student needs to bake. By using math to collect information, students can make good decisions that are sure to make the bake sale a success!
Session 6: Bake Sale Report
Students produce a report about how to make the bake sale a success. Using Microsoft Word, they explain their decisions about the sale. They describe the purpose of the sale, the item to be sold, financial goal, price of each item, total number of baked goods needed, and the amount each student in the class will need to bring to the sale. Afterwards, the report is edited to correct spelling and grammar errors. Upon completion, it is sent to the printer for publication.
Optional Data Analysis and Spreadsheet Lesson Plans
- Paint a Spreadsheet Picture: Fill cells with color to create a picture.
- Add Pictures into a Bar Graph: Transform each data point into a picture.
- Change the Chart Type: Explore ways to visually present the data.
- Formatting Tips for Pie Graphs: Sort data and explode a pie.
- Different Formulas, Same Result: Calculate values in cells
- About the Sale: Reflect on the results of the sale.


technokids.com –