Description
Spreadsheet Lessons for Elementary Grades
Spark student interest with fun and engaging spreadsheet lessons and word processing activities for beginners. In TechnoCandy, students embark on a real-world mission to enhance candy sales. They investigate the problem by conducting a survey and researching candy packaging. They use a spreadsheet to organize, calculate, and graph data. Then they develop a plan to boost sales by adjusting candy colors. Based on the evidence, students recommend a solution in a written report. This project seamlessly teaches spreadsheet skills in one meaningful, integrated project.
Authentic Spreadsheet Lessons for Kids Ages 8-11
Students build technology skills with a real-world task: reviving declining sales at a candy company. The inquiry-based approach captivates children, turning the project into a motivating learning opportunity.
Empower Learning through Active Engagement
Hook student interest and reinforce curriculum objectives with active learning. As students research the problem using a survey and then design a solution, they build problem solving strategies, grow their critical thinking skills, and develop creativity. Teach inquiry and analytic research methods by challenging students to solve a business problem. Develop confident risk-takers. Through decision-making simulations, students build essential personal skills like perseverance, self-management, initiative, and responsibility. TechnoCandy prepares students for the future by cultivating personal and social skills in addition to academics.
Easy-to-Follow Instructions
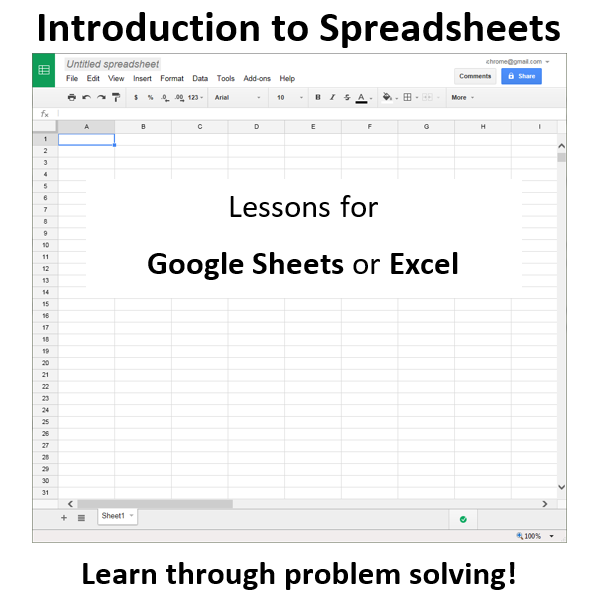
Resources include a comprehensive Teacher Guide with illustrated, step-by-step instructions to ensure easy navigation. Additional resources provided are assessment tools, optional extension activities, templates, and sample completed spreadsheets and reports. A fun Bingo game is included to make learning cell references enjoyable. Course includes age-appropriate lessons for students to learn either Google Sheets or Excel spreadsheet skills.
Integrate STEM into Lesson Plans
Create a blended learning environment. Combine technology with math though activities that focus on organizing, problem-solving, graphing, calculating, and sorting data. Connect mathematics to everyday challenges. Students make decisions based on real world data that they collected, making spreadsheets relevant.
Assignment 1 Spreadsheets and You
Recognize the practical application of spreadsheets. Set a goal for learning.
Assignment 2 Explore Spreadsheets
Learn spreadsheet terminology and acquire basic skills.
Assignment 3 Understand the Problem
Grasp the challenge facing the candy business. Formulate a plan to collect information.
Assignment 4 Conduct a Survey
Administer a survey about color preferences to research the problem.
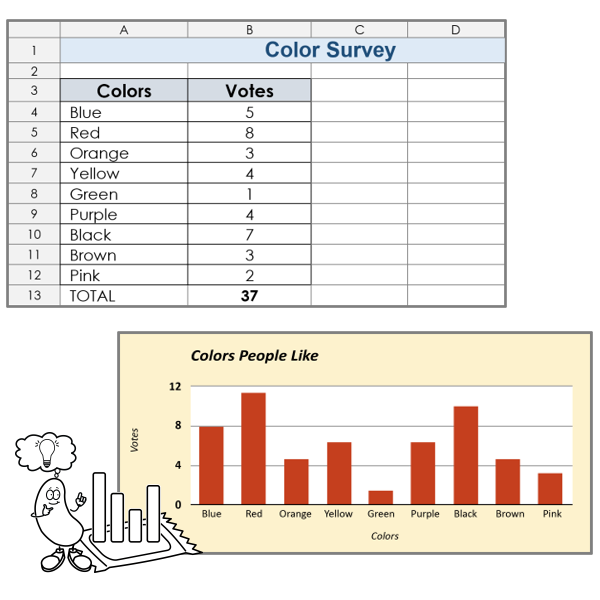
Assignment 5 Record Survey Results in a Spreadsheet
Organize survey results in a spreadsheet. Format the data to make it easy to read.
Assignment 6 Calculate Survey Data
Compute totals using the Sum function.
Assignment 7 Graph the Survey Results
Represent data in a column chart. Customize the chart style. Interpret the survey results.
Assignment 8 Research the Candy
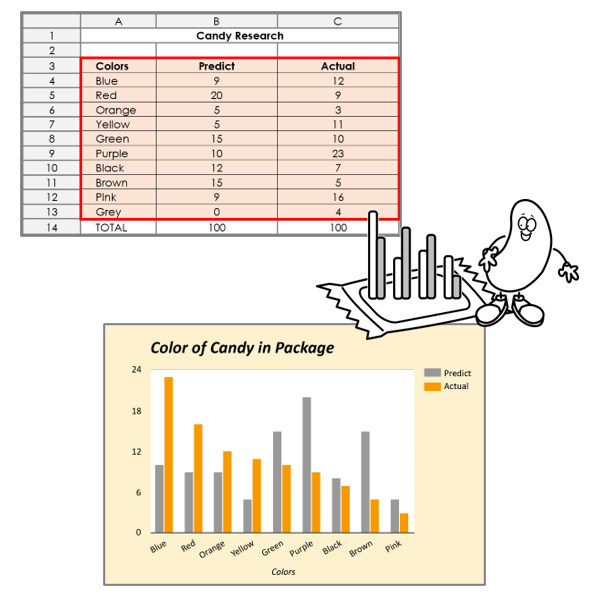
Investigate candy packaging. List predictions and actual amounts of colored candies.
Assignment 9 Record Research Results
Organize data in a new worksheet. Calculate totals using the Sum function.
Assignment 10 Make a Comparison Chart
Sort data. Create a double bar graph. Edit the title, legend, and axes. Analyze research findings.
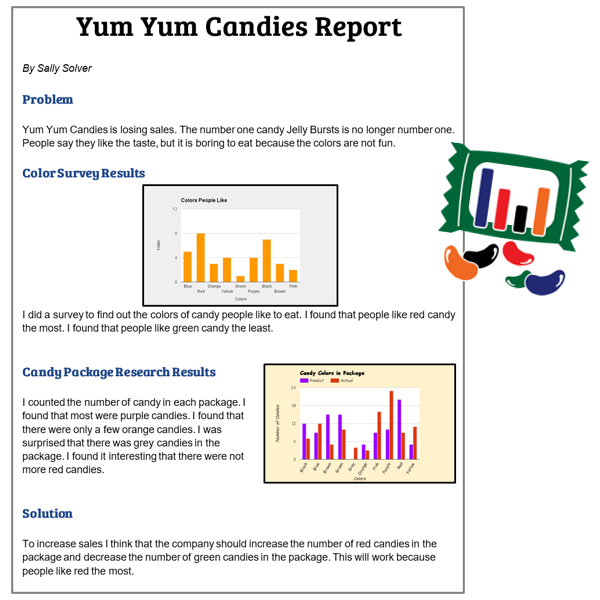
Assignment 11 Report Solution to the Problem
Recommend a proposal based on the evidence. Support reasoning using graphs.
Assignment 12 Submit the Report
Verify the report is complete using a checklist. Revise the content. Print or share the document.
Spreadsheet Activities for Beginners
Elementary students learn technology and math skills through problem solving in TechnoCandy. The spreadsheet lessons connect mathematics to a real-world situation that is simplified to make it understandable for children. Students are challenged to develop a solution that will increase candy sales. This project can be used to develop critical thinking, teach inquiry and analytic research methods, and build problem solving strategies.
- Connect mathematics to everyday life
- Investigate a problem using spreadsheets
- Conduct a survey and research packaging to collect data
- Develop a plan based on evidence
- Recommend a solution; explain reasoning in a written report
- Organize data in a spreadsheet using multiple sheets
- Interpret results using a single and double bar graph
- Format cells to make data easy to read
- Calculate data using formulas
- Sort data alphabetically and numerically
TechnoCandy | Spreadsheet Lessons
DownloadInvestigate a problem, conduct a survey, and propose a solution using Google Sheets or Excel spreadsheet lessons.


technokids.com –
technokids.com –
technokids.com –
technokids.com –
technokids.com –
technokids.com –
technokids.com –
technokids.com –