Middle school students can design an infographic using Google Sites. Google Sites, is a free app to anyone with a Google account. It is primarily a web design tool. However, it has many features that make it the ideal way for students In Grades 6-9 to create an infographic that is interactive, compelling, and lots of fun to build!
In a recent blog, we listed reasons for teachers to assign an infographic as an innovative method for students to demonstrate their learning. An infographic’s characteristics – simple graphics and brief text – as well as its interactive nature make it an ideal means of communication. As an alternative to report writing, students must use higher order thinking skills such as analysis and synthesis to summarize and condense information to the most essential facts to create an infographic.
The next decision is “What app should we use?” Here are some reasons to use Google Sites as an unlikely but ideal program to easily create an interactive infographic with elementary and middle school students.
Google Sites: A Great Fit for Making an Infographic
Divide Information Visually with Layouts
In Google Sites, the banner for the page title and various layout options are perfect for designing an infographic. The image blocks visually divide the separate parts of the infographic, which may be headings and text, clipart, number facts, links, and pictures. Sections draw the reader’s eye through the various parts of the document. The nature of simple web page building using image and text blocks makes creating an infographic with this tool so suitable.
Add Professionalism Using Themes
Google Sites helps students produce a professional looking infographic using themes. When a theme is chosen, the web document is limited to a coordinating palette of colors and fonts. This not only results in a high quality design but the publication appears well organized and integrated too. Scanning through the infographic is easier when the parts have a similar appearance.
Search for Images
Working within Google Sites, students can find and display the simple images that are typical of infographics. These cartoon-like pictures are used to convey data or facts quickly. Using the Insert Images tool, students search with keywords. By restricting the results to just Clip art or Line drawings, they can eliminate photographs and just find basic, universally recognized images ideal for an infographic.
Create Collapsible Text
One more reason to use Google Sites is that it provides collapsible text. This element can be added to create a box of text that can be expanded or collapsed by the viewer. Using this feature, you can give the option of looking at the contents or not, and thereby saving space on the document. In TechnoEarth, a collapsible text box is used to list sources of information for the infographic. If the reader would like to check facts or find out more about the topic, they can click to enlarge and see the contents. Often collapsible boxes are used for FAQs, allowing a viewer to scan through the questions and only read the answers of the ones in which they are interested.

Add an Image Carousel
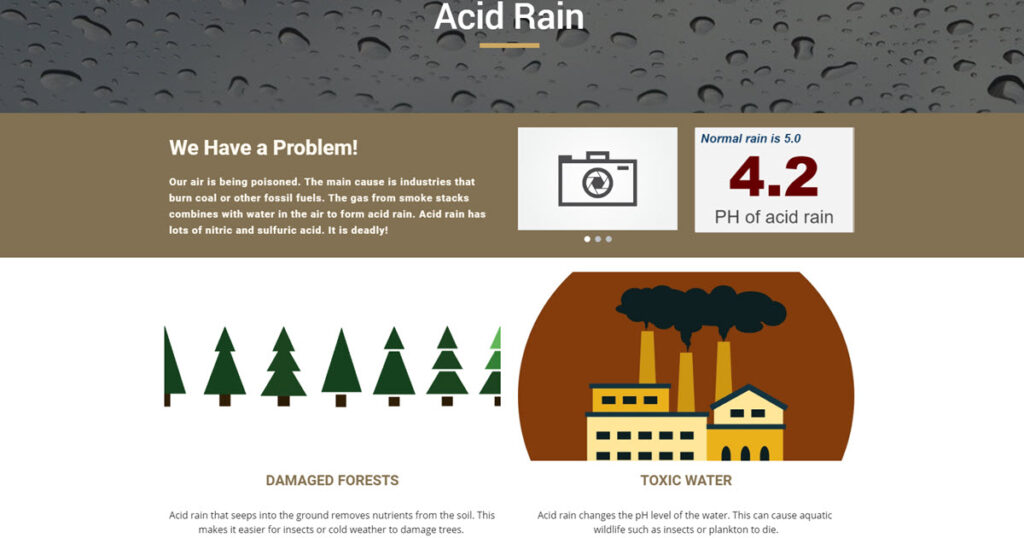
Infographics do not typically use photographs, but instead have cartoon-like images. However, there is a limitation to using just icons to advocate about an environmental issue. This is because photos that show the cause or harmful effects can make a powerful statement. The good news is that Google Sites lets you do both using an image carousel.
To make an infographic engaging and interactive, the image carousel feature can be added. It shows a collection of picture files, by scrolling from one to another. To keep the publication true to an infographic, the first image should be an icon of a camera. However, after that the images can be photographs. In the TechnoEarth project students include on their interactive infographic, photographs showing the effects of an environmental issue.

Insert a Google Slide Deck
Another great feature of Google Sites is the ability to insert a document made in other Google Apps such as Docs, Slides, Sheets, Forms, and more. To keep the viewer engaged, students can add a rotating slide deck created in Google Slides to an infographic. Using the many features of Slides, the deck can have distinctive layouts, unique formatting, word art, graphic organizers, and more. The slides display brief facts and eye-catching images. They are set to play automatically, adding interest and variety for the reader.

Design a Unique Drawing
Another file type that can be inserted into Google Sites is an image created in Google Drawings. As an alternative to searching for ready-made clip art, students can create their own one-of-a-kind artwork to add to their infographic. Instructions in TechnoEarth explain how to use the tools in Google Drawings to produce simple, but powerful icons. These graphics grab the viewer’s attention and communicate a concise message.
Highlight Locations with a Map
Google Sites allows users to insert interactive maps constructed using Google Maps. Most infographics pinpoint the location where an issue or topic is happening. The drawback is that viewers only see a static image. However, with Google My Maps viewers can actively explore. By clicking on custom map markers, they discover interesting facts and photos about each spot.

Learn How to Design an Infographic Using Google Sites
Want to get started on an infographic using Google Sites? TechnoKids has a project for you! In TechnoEarth, middle school students become environmental stewards as they design an interactive infographic. They use Google Sites, as well as Docs, Slides, Drawings, and more. They follow instructions to select an important, real-world issue. The infographic outlines the cause, harmful effects, and solutions. Stakeholders are identified. A thematic map shows where the problem is located. The final web based infographic will inform and inspire.